Analytics Command Center
The Analytics Command Center is a comprehensive analytics dashboard that provides deep insights into your router usage, model performance, cost tracking, and reliability metrics. Access it from your dashboard to monitor and optimize your AI infrastructure.
Dashboard Views
The Analytics Command Center offers three main tabs to analyze your data from different perspectives:
Overview gives you high-level metrics, usage timelines, and automated insights to quickly understand your router's performance at a glance.
Models provides detailed performance comparisons across all your models, helping you identify the most reliable and cost-effective options.
Raw Events exposes granular request-level data for debugging and detailed auditing when you need to investigate specific issues.
Filtering Your Data
Global filters at the top of the dashboard let you focus your analysis on specific timeframes and models. The time window filter offers quick access to the last 7, 14, or 30 days, or you can view your complete historical data with the "All time" option.
The model filter allows you to analyze aggregate metrics across your entire model pool or drill down into individual model performance. A current filters panel shows your active selections, including anonymization rates and average latency for the filtered dataset.
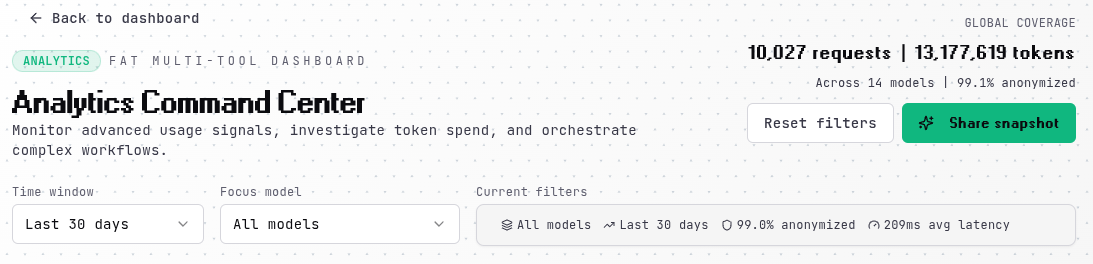
Reset Filters
Use the "Reset filters" button to quickly return to the default view.
Overview Tab
The Overview tab surfaces the most important metrics and trends from your router usage.
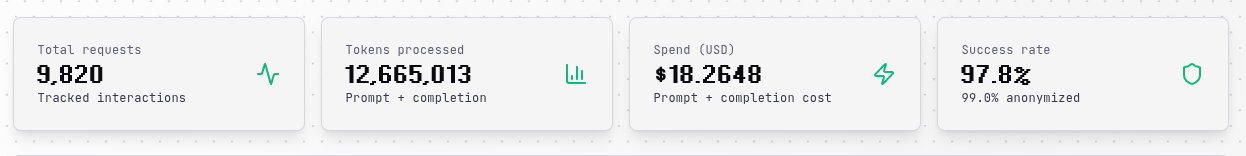
Key Metrics
Four metric cards at the top display your total requests, tokens processed, spend, and success rate. These provide an immediate snapshot of your router's activity and health within the selected timeframe.
Usage Timeline
The usage timeline uses dual axes to show both token consumption and costs over time, making it easy to correlate usage patterns with spending. The left axis tracks tokens in your accent color, while the right axis shows costs in blue. Both metrics are scaled independently so you can see trends comparably even when the absolute values differ significantly.
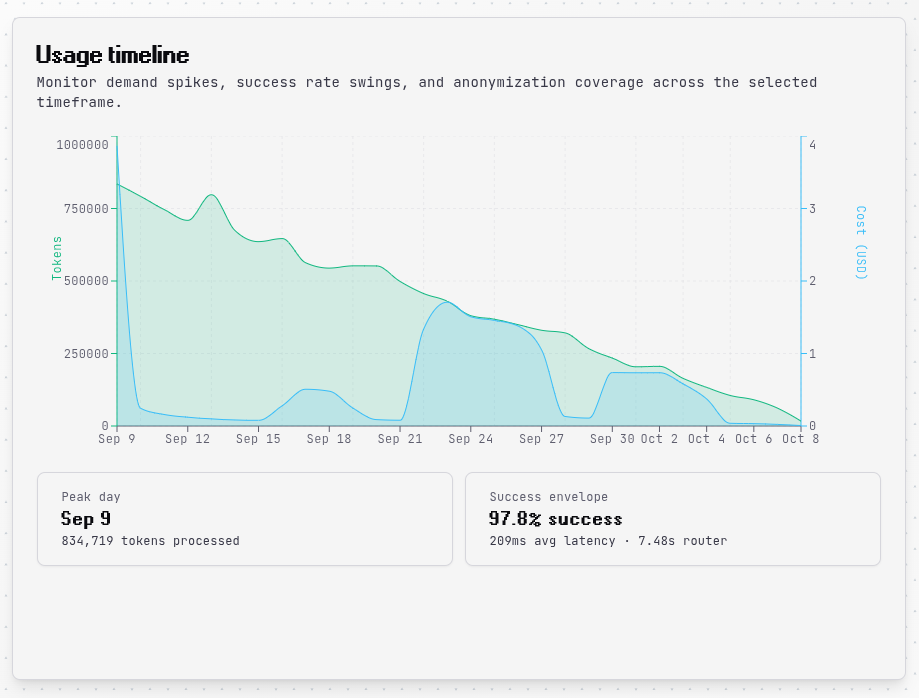
Below the timeline, you'll find your peak usage day and overall success metrics including average latency and router processing time.
Intelligence Feed
The intelligence feed automatically detects anomalies and surfaces actionable insights. Days with usage spikes 35% above your average are flagged with details about token count, cost, and success rate during the spike. This helps you quickly identify unusual activity and investigate the cause.
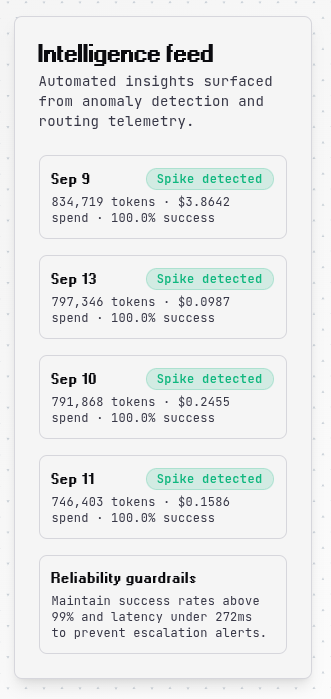
The feed also provides reliability guardrails, recommending thresholds for success rates and latency to maintain optimal performance.
Modality Breakdown
A pie chart and detailed breakdown show how your token usage and costs are distributed across different modalities like text, images, and audio. This visualization helps you understand which input types are driving your costs and optimize accordingly.
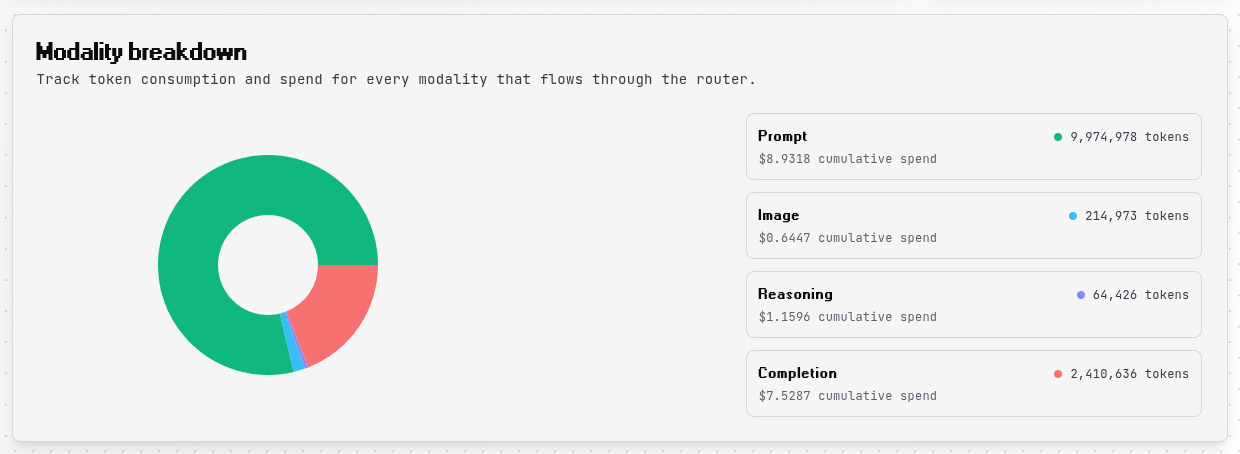
Modality Costs
Different modalities have different pricing structures. Image tokens are typically more expensive than text tokens, so monitoring this breakdown can reveal significant optimization opportunities.
Models Tab
The Models tab is your central hub for comparing model performance and identifying the best options for your use case.
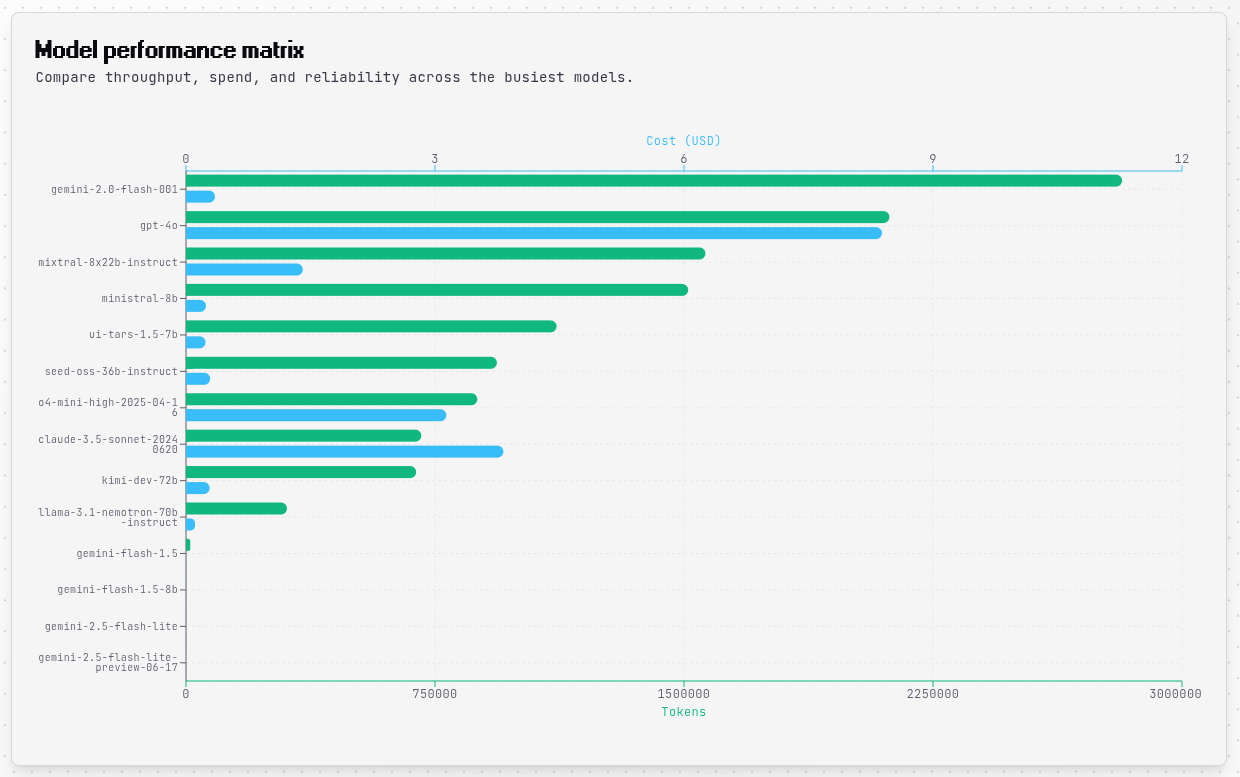
Model Performance Matrix
A horizontal bar chart displays all models that processed requests in your selected timeframe. The chart uses dual axes with tokens on the bottom (in your accent color) and costs on the top (in blue), allowing you to compare both metrics simultaneously. Model names are automatically wrapped to prevent truncation, and the chart expands vertically to show all models without scrolling.
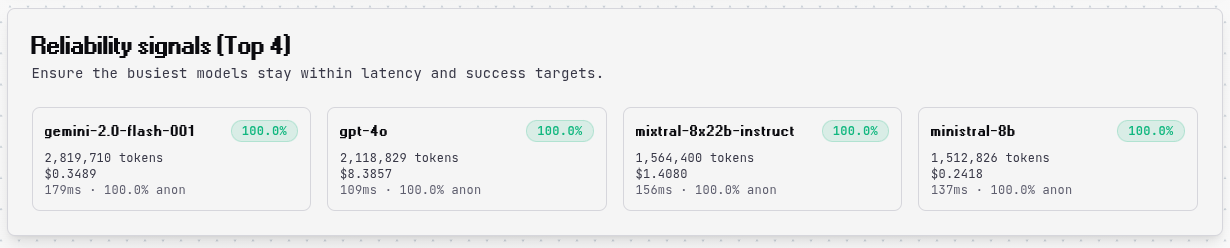
Reliability Signals
The top 4 models by token usage are highlighted with detailed reliability metrics including success rate, total tokens, cost, latency, and anonymization rate. These cards help you quickly identify your most-used models and spot any reliability issues that need attention.
Detailed Performance Table
A comprehensive table provides a complete breakdown of every model with columns for requests, tokens, spend, success rate, anonymization rate, and latency. The table expands to show all models, making it easy to compare performance across your entire model pool at once.
Raw Events Tab
The Raw Events tab gives you access to granular, request-level data for debugging and detailed auditing.
Event Table
Each row in the event table represents a single API request, showing the timestamp, model, tokens, cost, latency, router processing time, anonymization status, and request status. Errors are highlighted in red for quick identification. The table displays up to 200 recent events with scrollable navigation.
Exporting Data
The "Export visible dataset" button copies up to 200 filtered events as JSON to your clipboard, making it easy to import data into external analytics tools, create custom reports, or archive historical data for compliance purposes.
Best Practices
Monitoring Performance
Start by reviewing your "All time" metrics to establish a baseline understanding of normal usage patterns. Monitor the Overview tab regularly for anomalies or unexpected spikes. When you notice errors or failures, use the Raw Events tab to investigate specific requests and identify patterns.
Use the Modality Breakdown to understand which input types are consuming the most tokens and driving costs, then optimize accordingly. For example, if image processing is expensive, consider reducing image resolution or frequency.
Optimizing Model Selection
The Models tab makes it easy to compare reliability across your model pool. Look for models with consistently high success rates and low latency to ensure reliable performance. Balance cost against quality by identifying models that deliver good results at lower price points.
Before scaling traffic to a new model, use private groups to test it with a subset of requests and monitor its performance in the analytics dashboard. This helps you catch issues before they impact production workloads.
Managing Costs
Watch the Usage Timeline for cost trends over time to understand how your spending evolves. Use the Model Performance Matrix to identify which models are driving the highest costs, then evaluate whether cheaper alternatives might work for your use case.
The dual-axis charts help you spot models with high token usage but low cost (efficient models) versus models with low token usage but high cost (expensive per token). This insight guides decisions about which models to use for different types of requests.
Data Retention
Analytics data retention periods vary by plan tier. Higher tiers offer longer retention for historical analysis.
Troubleshooting
No Data Showing
If the dashboard appears empty, verify that you've made API requests through the router and that your selected timeframe includes recent activity. Try expanding to "All time" to see if historical data appears. Ensure your API key is correctly configured and authenticated.
Unexpected Costs
When costs are higher than expected, start by reviewing the Modality Breakdown to see if expensive input types like images are driving spend. Check the Model Performance Matrix to identify high-cost models, then use the Raw Events tab to examine individual expensive requests in detail.
Remember that images count as approximately 1024 tokens per 1024x1024 resolution, which can add up quickly if you're processing many images or high-resolution inputs.
Low Success Rates
If success rates drop below acceptable levels, check the Raw Events tab for error patterns and identify which models are failing. Verify that your requests include only parameters supported by your selected models. Ensure your model group includes models compatible with the capabilities you need, such as image analysis, function calling, or streaming.
Advanced Features
Anomaly Detection
The automatic anomaly detection in the Intelligence Feed flags unusual activity without manual monitoring. When you see a spike, correlate it with business events, product launches, or other activities that might explain the increase. Use these patterns to plan capacity for recurring events or seasonal variations.
Dual-Axis Charts
Both the Usage Timeline and Model Performance Matrix use dual axes to display tokens and costs together on the same chart. This design makes it easy to understand the relationship between usage volume and spending, helping you identify efficient models and optimize your model selection strategy.
Dynamic Scaling
All charts and tables automatically scale to accommodate your complete dataset without pagination or excessive scrolling. This design philosophy ensures you can see the full picture at a glance, making it easier to spot patterns and outliers across your entire model pool.